
Festival site maps: Static vs interactive maps
Festival site maps help attendees navigate an event — from finding stages to locating food and facilities. Most festivals still use static PDFs or images. While simple, these don’t reflect how people actually explore an event.


Festival site maps help attendees navigate an event – from finding stages to locating food and facilities.
Most festivals still use static PDFs or images. While simple, these don’t reflect how people actually explore an event.
At Eventplot, we’ve been exploring a different approach – where the map is built as part of planning and becomes an interactive experience.
Static maps
Most organisers use:
- PDF downloads
- Printed maps
- Static images
Pros:
- Easy to create
- Familiar format
Cons:
- Hard to read on mobile
- Not interactive
- Cannot update easily
- No connection to event data
Interactive maps
Interactive maps allow users to:
- Zoom and explore
- Click on stages and vendors
- Access more information
Benefits:
- Better user experience
- More engaging
- Mobile-friendly
However, many are still disconnected from planning tools.
3D maps
3D maps offer a more intuitive way to understand space.
Attendees can:
- See the layout clearly
- Understand distances
- Explore before arriving
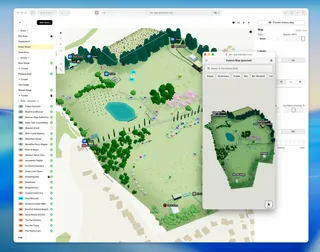
Eventplot uses a 3D model of the event, built during planning, and turns it into a live interactive map.
The key difference
A connected approach
Traditionally:
- Planning happens in one tool
- Maps are created separately
- Websites are built separately
With Eventplot:
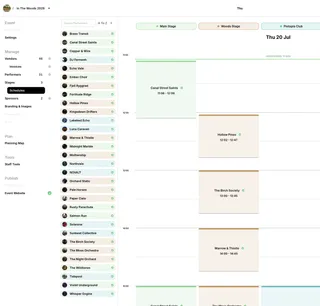
- Add a stage → appears on the map
- Place a vendor → instantly visible
- Update layout → reflected automatically
The map becomes a live representation of the event.
Final thought
Static maps still work for simple events, but they quickly break down as complexity grows.
Interactive and 3D maps provide a clearer, more engaging way for attendees to explore a festival.
Explore more:
https://eventplot.com